News CNCnetPDM About us Support  


EQUIPMENT SCRAP ANALYSIS | DASHBOARDS

TOP

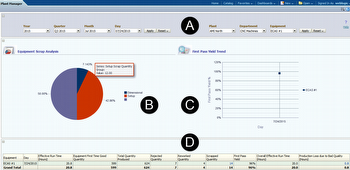
This dashboard shows an analysis about bad quality produced by manufacturing equipment in one or all departments of a plant (A) within a selected period. Right to a pie chart (B) which contains the percentage distribution of scrap quantity a graph with the first pass yield trend of the machines is shown.

In addition to the effective run time of the equipment the table (D) at the bottom shows first time good quantity, total quantity produced, rejected quantity, reworked quantity scrapped quantity, first pass yield, overall effective run time and production loss due to bad quality for the equipment.

Equipment Scrap Analysis

FIG 1:    Plant Manager Dashboard - Equipment Scrap Analysis (click to enlarge)

As the vast majority of machines used by discrete manufacturers usually is not able to decide about the produced quality this data is acquired in a subsequent quality assurance (QA) operation. The machine itself automatically reports ‘total quantity produced’ which is separated up into good, rejected, reworked and scrapped parts by the QA operation.

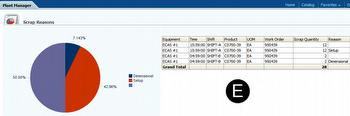
Clicking on the field ‘scrapped quantity’ in table (D) opens up the scrap reasons report (E) which shows reporting time, shift, product, unit of measure (UOM), work order, scrap quantity and reason for scrapped parts produced.

Scrap Reasons Report

FIG 2:    Plant Manager Dashboard - Scrap Reasons Report (click to enlarge)

Privacy notice

This website uses cookies. By continuing to use it you agree to our privacy policy. 

https://www.inventcom.net/oracle-manufacturing-operations-center/dashboards/equipment-scrap-analysis

Oracle Manufacturing Operations Center | Dashboards | Overview

Oracle’s Manufacturing Operations Center (MOC) uses the concept of providing web- and role-based dashboards for different employees to gain the insights they need too. The... [read more]
Oracle Manufacturing Operations Center | Dashboards | Overview

Oracle Manufacturing Operations Center | Dashboards | Production Supervisor

This dashboard acts like an electronic whiteboard that automatically fetches data from your shop floor devices and provides real-time information about equipment status and... [read more]
Oracle Manufacturing Operations Center | Dashboards | Production Supervisor

Oracle Manufacturing Operations Center | Dashboards | Overall Equipment Effectiveness OEE

The standard of Oracle’s Manufacturing Operations Center (MOC) ships with a dashboard called ‘Plant Manager’ which includes several reports that output Overall... [read more]
Oracle Manufacturing Operations Center | Dashboards | Overall Equipment Effectiveness OEE

Oracle Manufacturing Operations Center | Dashboards | Production Loss Analysis

This dashboard outputs information about production loss distribution (B), effective production capacity (C) and production loss (D) for machines in a department of a plant... [read more]
Oracle Manufacturing Operations Center | Dashboards | Production Loss Analysis

Oracle Manufacturing Operations Center | Dashboards | Equipment Downtime Analysis

This dashboard shows downtime reasons machines in one or all departments of a plant within a selected period (A). The pie chart (B) below the selection area outputs the... [read more]
Oracle Manufacturing Operations Center | Dashboards | Equipment Downtime Analysis

Oracle Manufacturing Operations Center | Dashboards | Production Slippage Trend

This dashboard, accessible from the equipment downtime analysis report outputs, in addition to total production value (A), production slippage hours (B) and a performance to... [read more]
Oracle Manufacturing Operations Center | Dashboards | Production Slippage Trend

Oracle Manufacturing Operations Center | Dashboards | Equipment Idle Time Reasons

By using this dashboard the reasons for idle times of machines within a selected period (A) can be analyzed. Right to the pie chart (B) with percentage distribution of... [read more]
Oracle Manufacturing Operations Center | Dashboards | Equipment Idle Time Reasons

Oracle Manufacturing Operations Center | Dashboards | Equipment Efficiency Analysis

For selected equipment in one or all departments of a plant (A) this dashboard outputs an analysis about the efficiency of the manufacturing resources within a period of time. In... [read more]
Oracle Manufacturing Operations Center | Dashboards | Equipment Efficiency Analysis

Oracle Manufacturing Operations Center | Dashboards | Batch Performance

This dashboard provides analytics tools for work orders executed within a selected period in all or single plants and product categories (A). The graph (B) on the left side below... [read more]
Oracle Manufacturing Operations Center | Dashboards | Batch Performance

Oracle Manufacturing Operations Center | Dashboards | Production Performance

This dashboard enables comparison of scheduled with actual equipment usage. Output can be limited to one or all departments in a plant within a selected period (A). The... [read more]
Oracle Manufacturing Operations Center | Dashboards | Production Performance
Modified: 2016-09-20